INP Debugger
Identifying and removing bottlenecks in interactivity

Advantages

Accurate INP analysis
Measure response times to user actions including clicks, keystrokes, and taps to identify lags in interactivity.
Identifying performance bottlenecks
Identifying elements and processes that cause delays, such as long JavaScript execution, complex styles, or excessive DOM changes.
Recommendations for optimisation
Providing specific advice on how to improve INP, including code minimisation, rendering optimisation and the use of asynchronous downloads.
Improving user experience and SEO
Improving site responsiveness promotes a better user experience and can positively impact search engine rankings.
How it works
Tools
FAQ
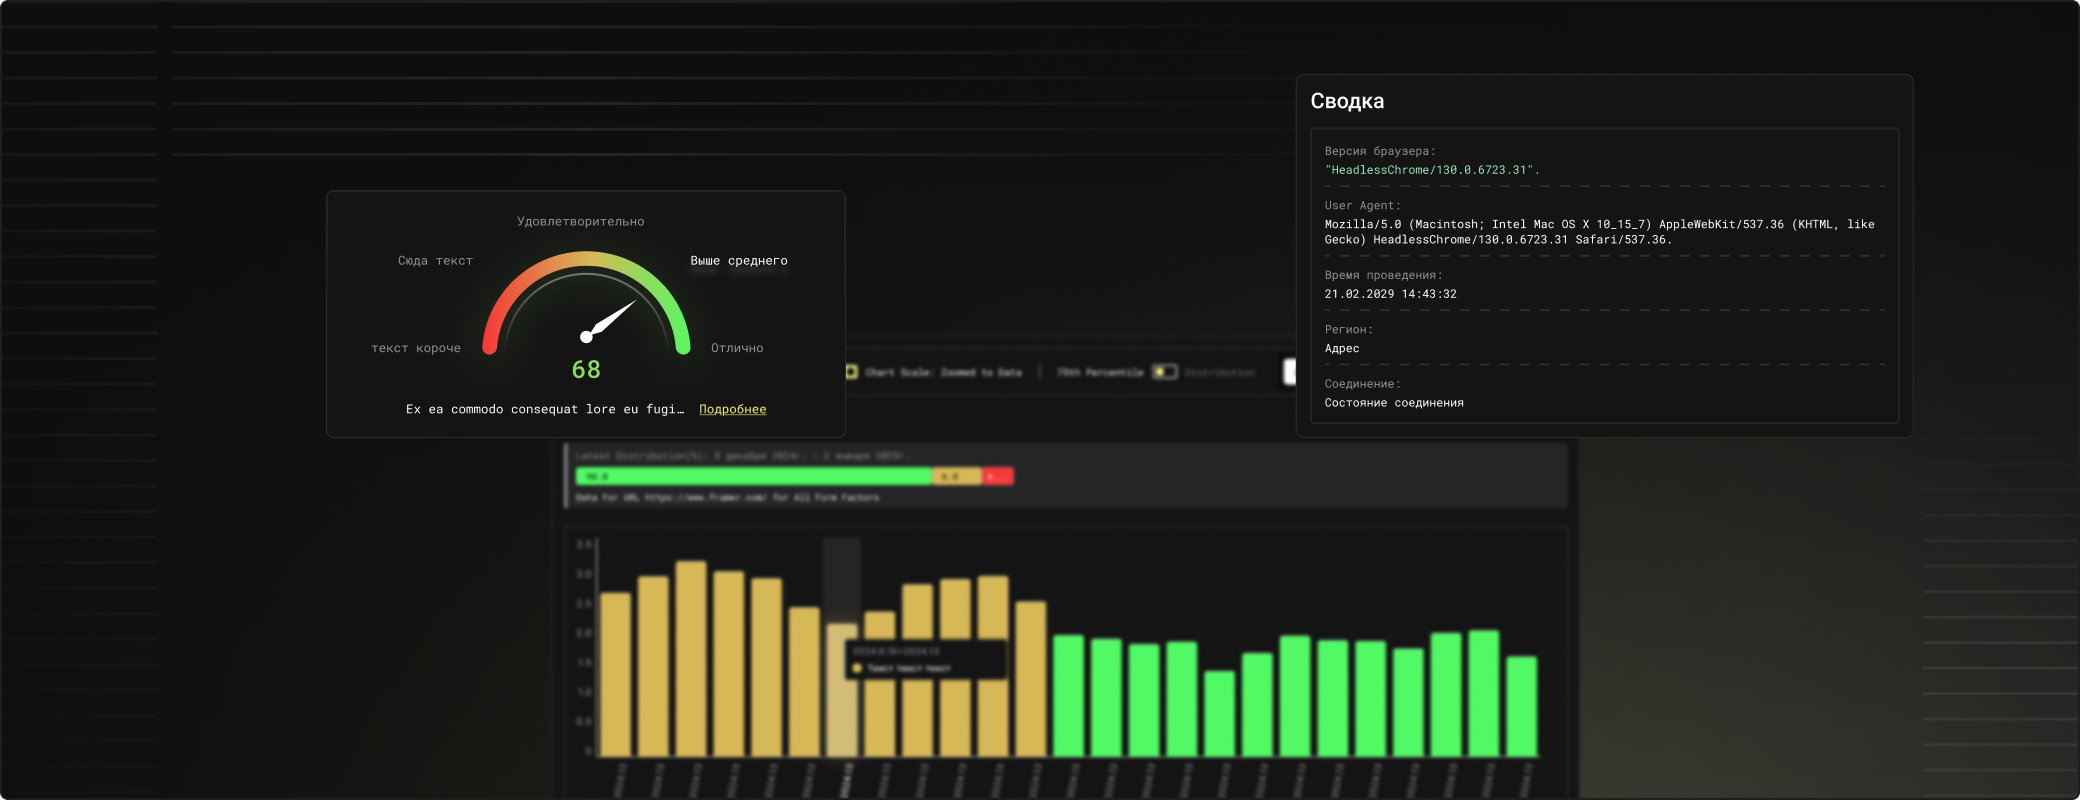
INP (Interaction to Next Paint) is a metric that measures the time from a user's interaction with a site to the next paint. It reflects the overall responsiveness of a site and affects user experience and SEO.
INP measures the delay between a user action (such as a click) and when the browser displays the next frame. This includes input delay, processing time, and display delay.
An INP of less than 200 ms is considered good, 200 to 500 ms requires improvement, and more than 500 ms is considered poor.
Optimise JavaScript, reduce DOM complexity, use asynchronous resource loading and minimise CSS and HTML. It's also important to use tools like Chrome DevTools and PageSpeed Insights to analyse and troubleshoot issues.
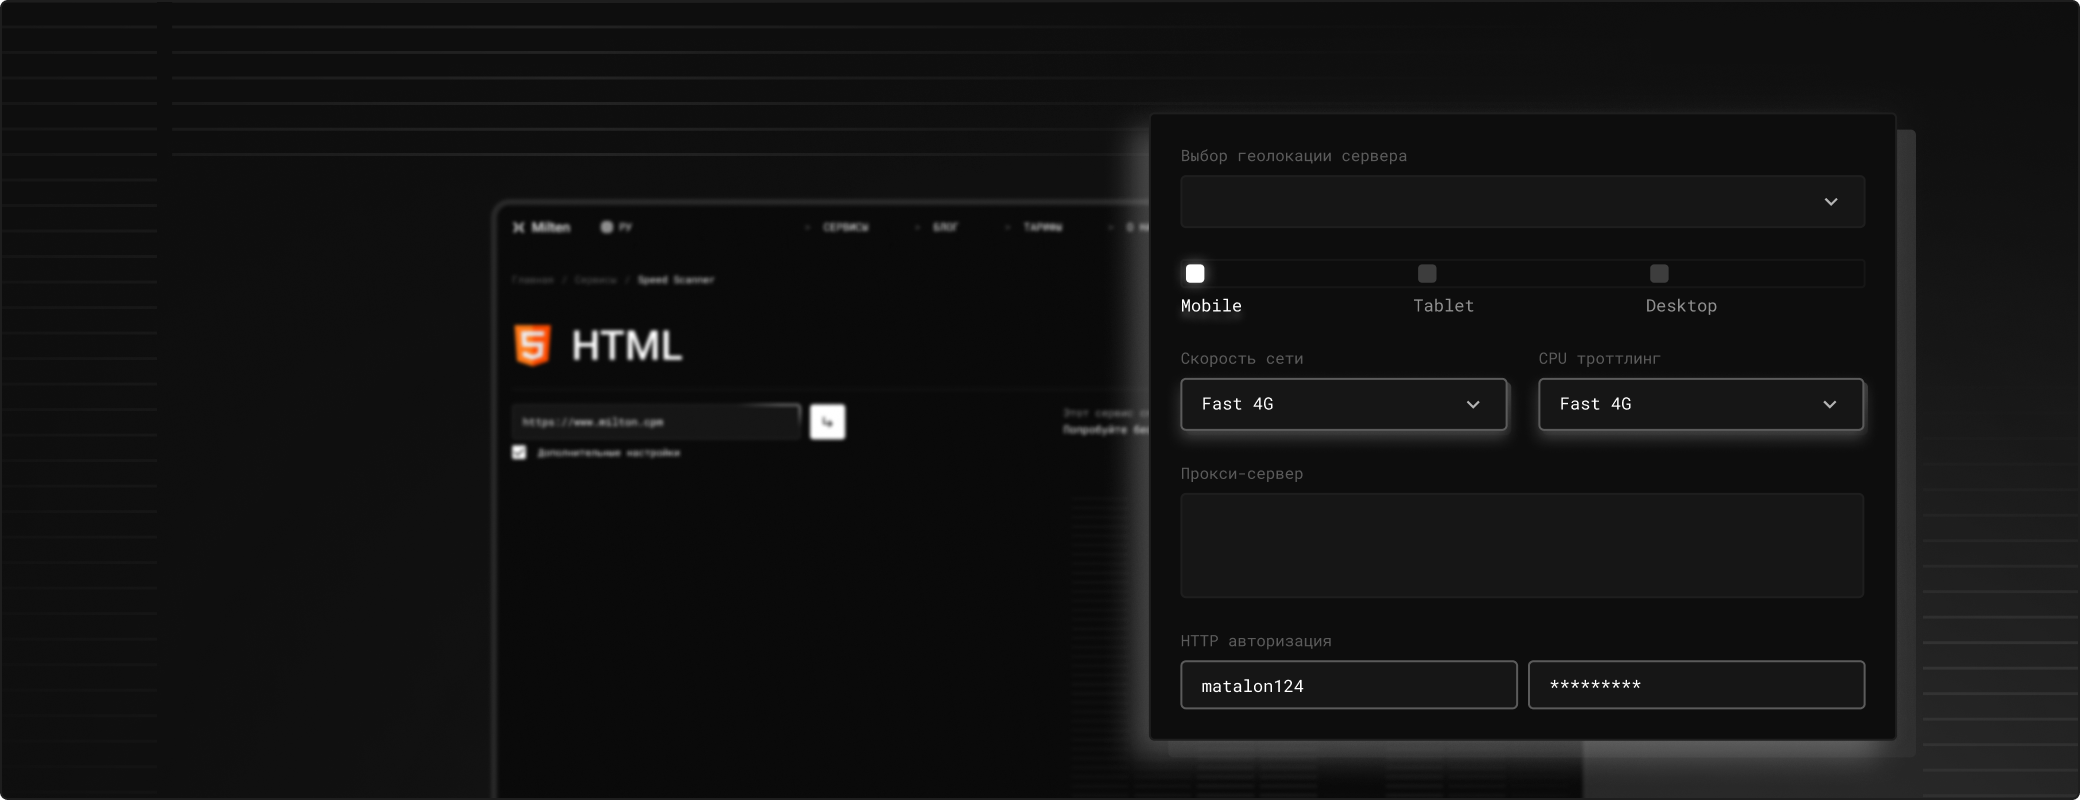
Yes, the service emulates mobile conditions (slow CPU, 4g network) and analyzes INP taking into account the limitations of mobile browsers.