Memory leaks
Detect memory leaks with iterative heap snapshot analysis

Advantages

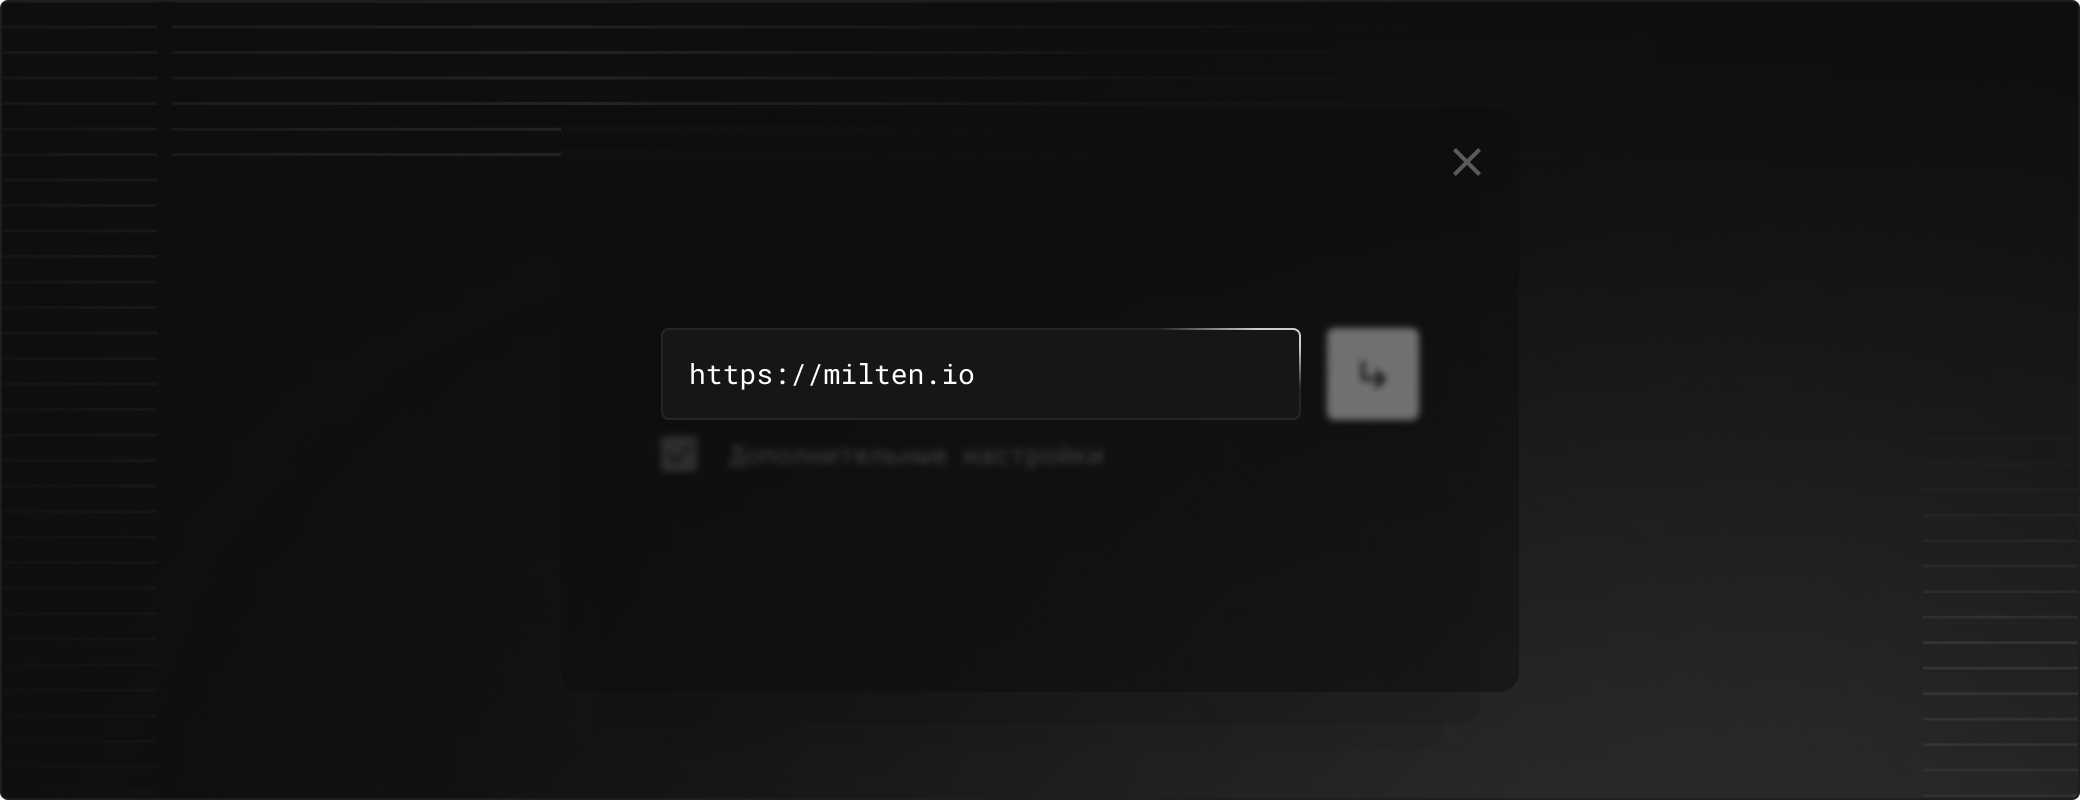
Iterative heap snapshot comparison
The tool navigates pages multiple times and compares heap snapshots between iterations — confirming genuine memory growth, not one-off allocations.
Four categories of leak detection
Detects leaking heap objects, growing collections (Array, Map, Set), accumulated event listeners, and detached DOM nodes that remain in memory after navigation.
Byte-level memory delta tracking
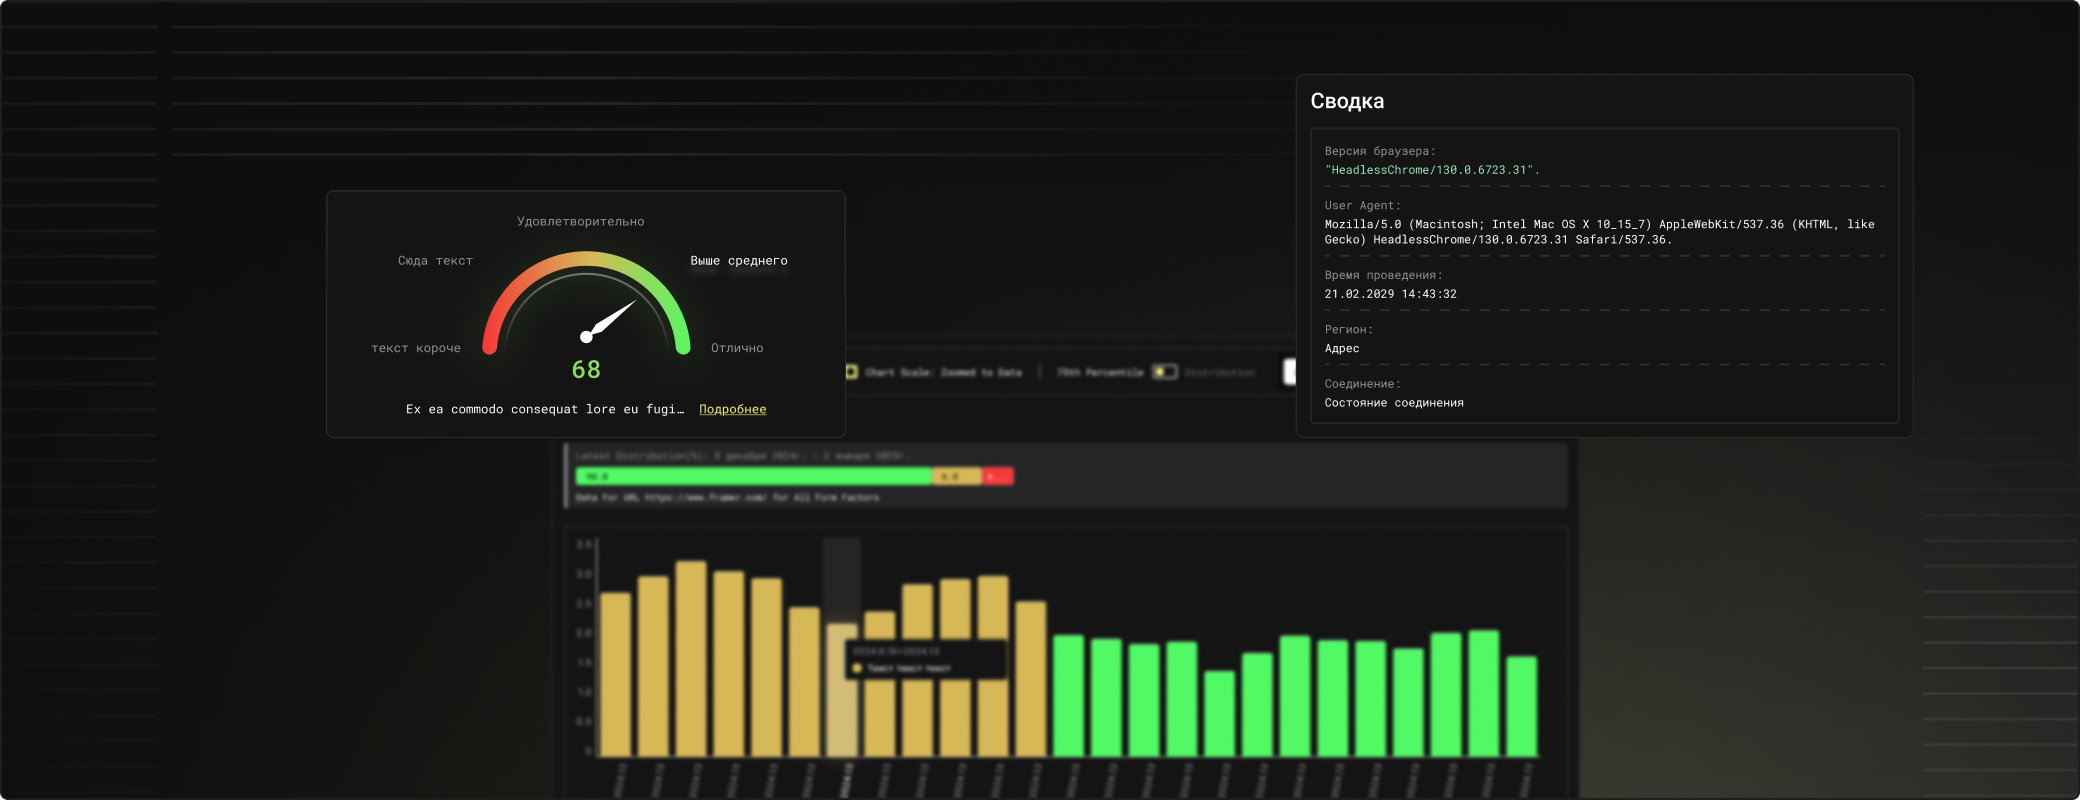
See exactly how many bytes each page leaks per iteration, with retained size deltas and distance from GC root for every suspicious object.
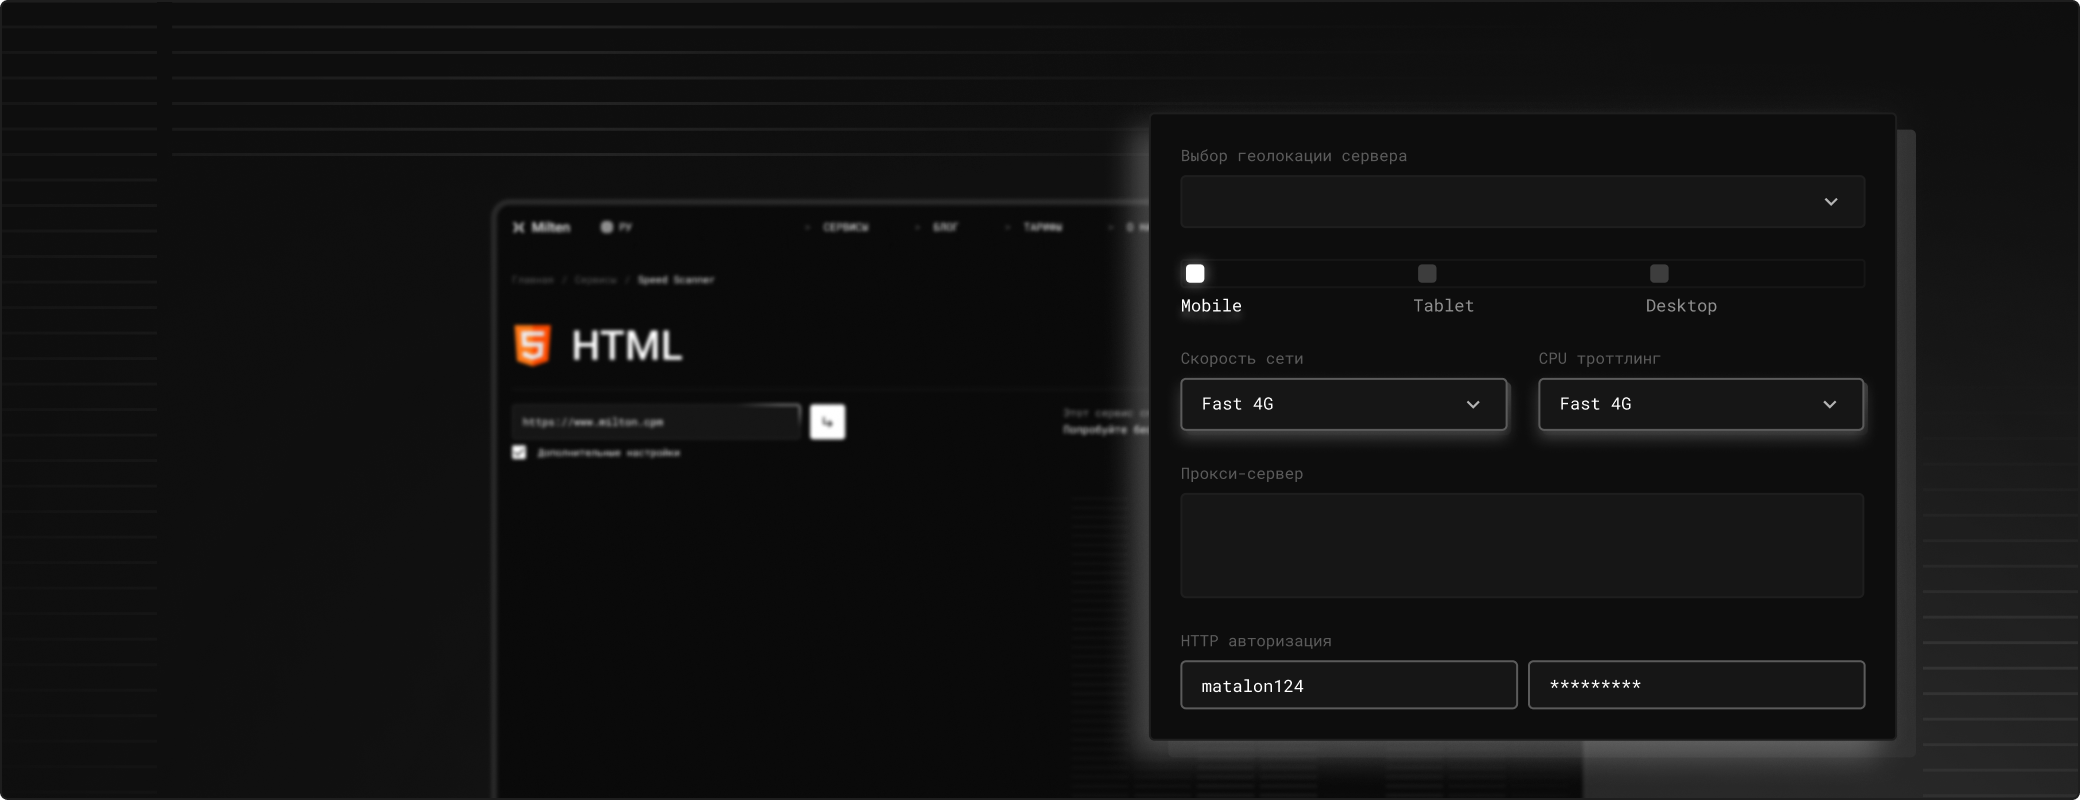
Multi-page automated crawling
Automatically navigates through your site's pages, running leak detection on each — so you catch leaks across the entire user journey, not just on one route.
How it works
Tools
FAQ
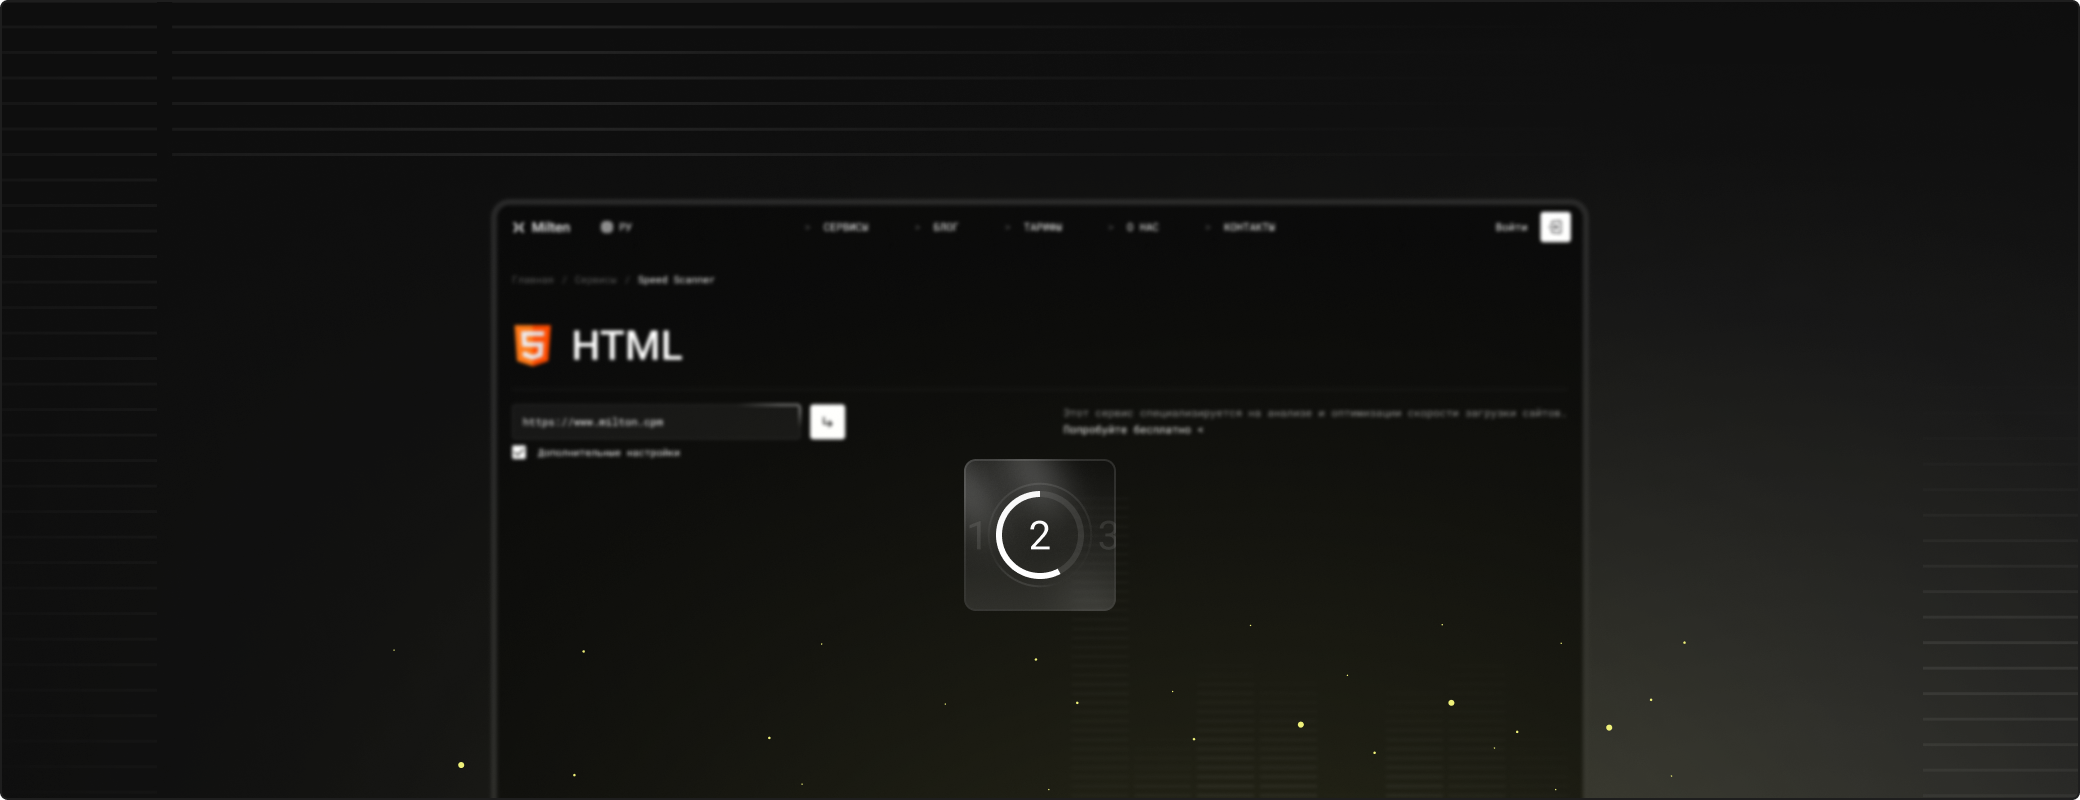
The tool loads a page, takes a heap snapshot, navigates away and back several times, then takes another snapshot. Objects that grow consistently across iterations are flagged as leaks — ruling out one-time allocations.
Detached DOM nodes are HTML elements that have been removed from the page but are still held in memory by JavaScript references. They are a common source of memory leaks in single-page applications.
Yes. The tool tracks the count of each event listener type across iterations. If listener counts grow without being cleaned up, they are flagged with the specific event name and affected DOM node.
Absolutely. SPAs are the most common source of memory leaks because components mount and unmount without full page reloads. The iterative navigation pattern is designed specifically for this scenario.
The report shows the object type, retained size, and growth pattern. Common fixes include cleaning up event listeners in useEffect cleanup functions, nullifying references to removed DOM nodes, and clearing intervals or timeouts.